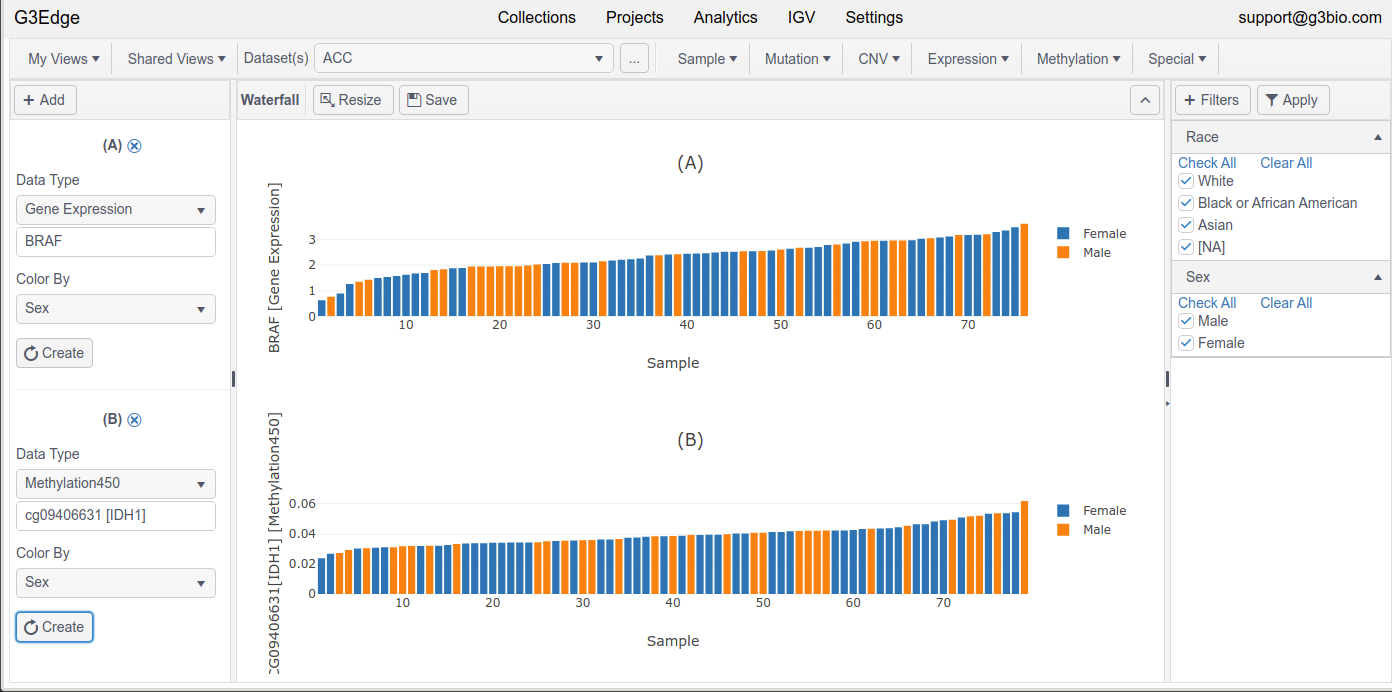
COLLECTIONS VIEW BULK SAMPLEWaterfall PlotWaterfall view Usage View sorted numeric levels colored by a groupInputSelect a data type and input a feature name (e.g. a gene)A (categorical) Group By columnNotesFor gene expression waterfall plot, simply click Expression > Expression Waterfall view.Getting StartedQuick TourDataHubViews - Bulk CollectionCNV > CNV DistributionCNV > Gene ListExpression > Expression GroupingExpression > Expression HeatmapExpression > Expression VolcanoExpression > Expression WaterfallMethylation > Methylation Beta ValuesMutation > Alteration DistributionMutation > Mutated GenesMutation > Mutation LandscapeSample > Data AvailabilitySample > Sample DetailsSample > Sample GroupingSpecial > WaterfallSpecial > CorrelationSpecial > Grid PatternSpecial > SurvivalViews - Single Cell CollectionCell > Cell DetailsCell > Cell GroupingCell > Cell Grouping (Proportion)CorrelationDot PlotFeatureMarkersViolin PlotAnalyticsAffymetrixDESeq2FGSEAgscreendSeuratSTACASProjectsCommandsg3toolsConvertMetaDataConvertDataLoadDataLoadSingleCellRunAnalysisInstallationServer Installation (AMI-Based)Server Installation (Docker-Based)