G3Bio

  • About
  • Gallery
  • Docs
  • Contact
COLLECTIONS VIEW SINGLE CELL

Single Cell - Markers

Cell Markers

Usage

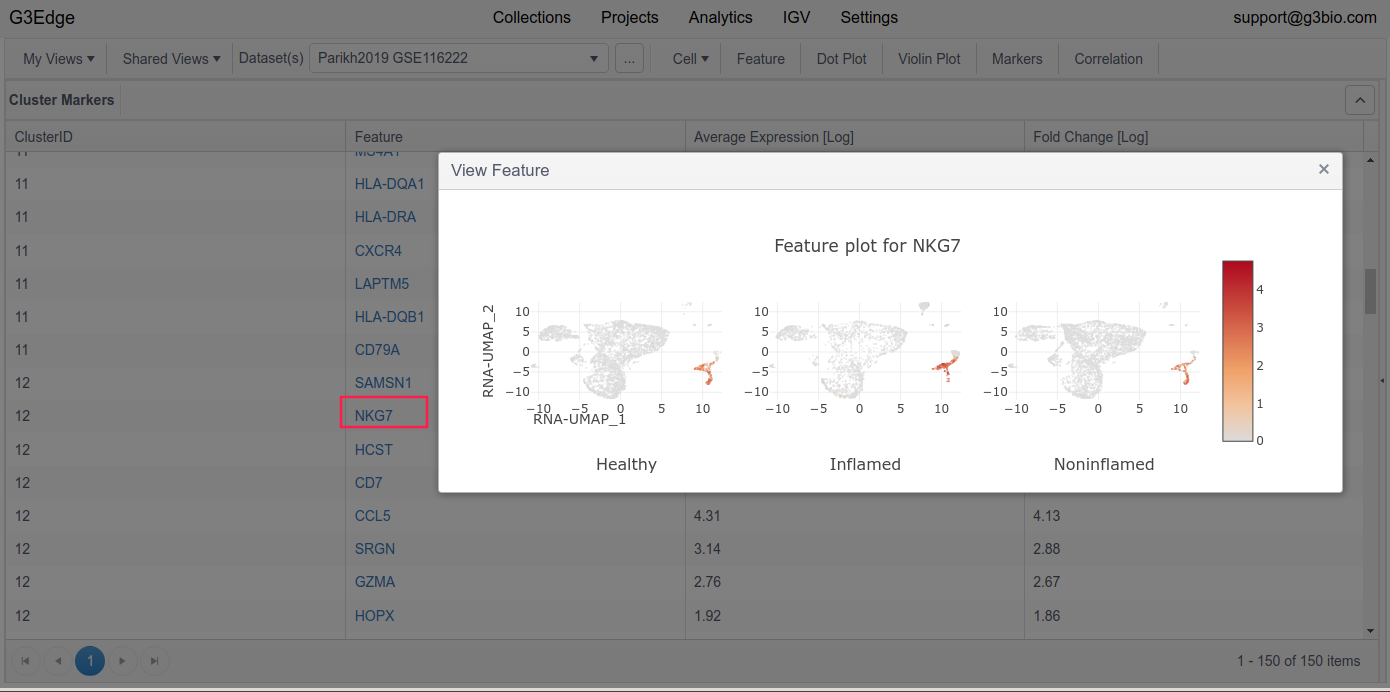
Clicking Markers button will show a table view of cell markers unique to each cluster (e.g. from calling Seurat “FindAllMarkers”). Further clicking a gene name will pop-up a window showing the “Feature” plot colored by the expression values of that gene.

  • Input

    • None
  • Notes

    • The feature plot means to provide a quick view of gene expression levels across cells. For more plotting flexibility, please refer to the Feature view.
  • Getting Started
    • Quick Tour
  • DataHub
  • Views - Bulk Collection
    • CNV > CNV Distribution
    • CNV > Gene List
    • Expression > Expression Grouping
    • Expression > Expression Heatmap
    • Expression > Expression Volcano
    • Expression > Expression Waterfall
    • Methylation > Methylation Beta Values
    • Mutation > Alteration Distribution
    • Mutation > Mutated Genes
    • Mutation > Mutation Landscape
    • Sample > Data Availability
    • Sample > Sample Details
    • Sample > Sample Grouping
    • Special > Waterfall
    • Special > Correlation
    • Special > Grid Pattern
    • Special > Survival
  • Views - Single Cell Collection
    • Cell > Cell Details
    • Cell > Cell Grouping
    • Cell > Cell Grouping (Proportion)
    • Correlation
    • Dot Plot
    • Feature
    • Markers
    • Violin Plot
  • Analytics
    • Affymetrix
    • DESeq2
    • FGSEA
    • gscreend
    • Seurat
    • STACAS
  • Projects
  • Commands
    • g3tools
    • ConvertMetaData
    • ConvertData
    • LoadData
    • LoadSingleCell
    • RunAnalysis
  • Installation
    • Server Installation (AMI-Based)
    • Server Installation (Docker-Based)
G3Bio Logo
 

Copyright © G3Bio 2025

  • About
  • Gallery
  • Docs
  • Contact
  • Getting Started
  • DataHub
  • Views - Bulk Collection
  • Views - Single Cell Collection
  • Analytics
  • Projects
  • Commands
  • Installation