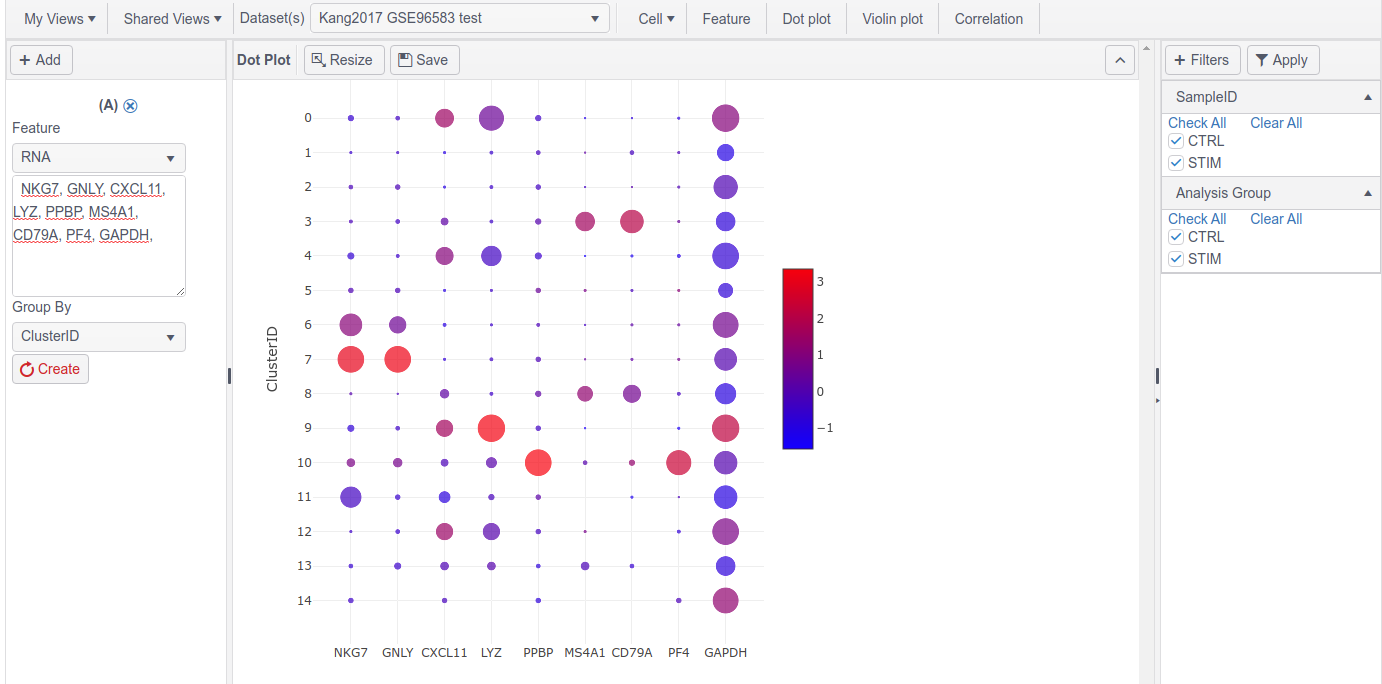
COLLECTIONS VIEW SINGLE CELLSingle Cell - Dot PlotDotPlot view Usage This chart allows to view feature patterns, such as gene co-expression across cell clusters.InputFeature: select a feature type and then input a list of feature namesGroup By: the column shown on Y-axisOptionsClick Add to create additional charts and show side-by-side.Getting StartedQuick TourDataHubViews - Bulk CollectionCNV > CNV DistributionCNV > Gene ListExpression > Expression GroupingExpression > Expression HeatmapExpression > Expression VolcanoExpression > Expression WaterfallMethylation > Methylation Beta ValuesMutation > Alteration DistributionMutation > Mutated GenesMutation > Mutation LandscapeSample > Data AvailabilitySample > Sample DetailsSample > Sample GroupingSpecial > WaterfallSpecial > CorrelationSpecial > Grid PatternSpecial > SurvivalViews - Single Cell CollectionCell > Cell DetailsCell > Cell GroupingCell > Cell Grouping (Proportion)CorrelationDot PlotFeatureMarkersViolin PlotAnalyticsAffymetrixDESeq2FGSEAgscreendSeuratSTACASProjectsCommandsg3toolsConvertMetaDataConvertDataLoadDataLoadSingleCellRunAnalysisInstallationServer Installation (AMI-Based)Server Installation (Docker-Based)