G3Bio

  • About
  • Gallery
  • Docs
  • Contact
COLLECTIONS VIEW SINGLE CELL

Single Cell - Feature

Feature view

Usage

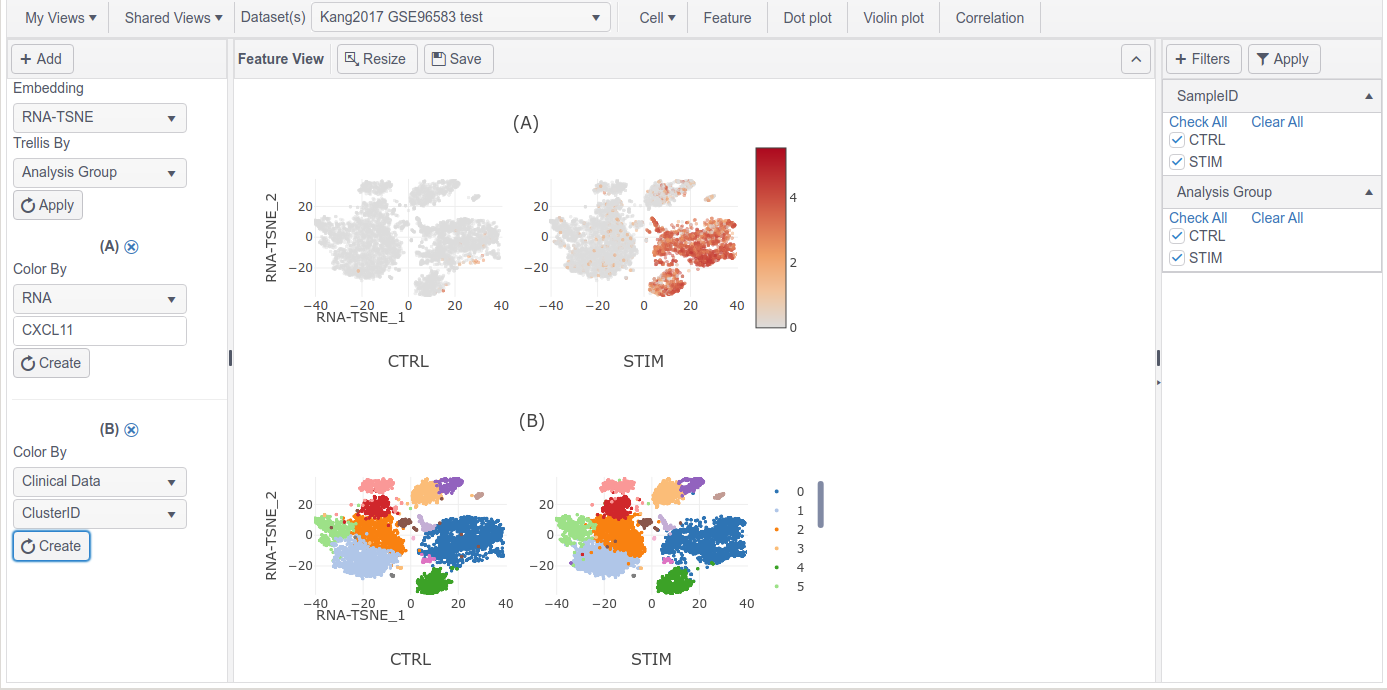
This view allows the visualization of one or multiple features on the dimension reduction plots, such as on tSNE or UMAP.

  • Input

    • Embedding: select a dimension reduction method.
    • Trellis By: a metadata column used to split the plots ; choose “None” if splitting is irrelevant.
  • Notes

    • Click Add to view additional features and show side-by-side.
    • Point and click a category value – in legend – to hide/unhide that group.
  • Getting Started
    • Quick Tour
  • DataHub
  • Views - Bulk Collection
    • CNV > CNV Distribution
    • CNV > Gene List
    • Expression > Expression Grouping
    • Expression > Expression Heatmap
    • Expression > Expression Volcano
    • Expression > Expression Waterfall
    • Methylation > Methylation Beta Values
    • Mutation > Alteration Distribution
    • Mutation > Mutated Genes
    • Mutation > Mutation Landscape
    • Sample > Data Availability
    • Sample > Sample Details
    • Sample > Sample Grouping
    • Special > Waterfall
    • Special > Correlation
    • Special > Grid Pattern
    • Special > Survival
  • Views - Single Cell Collection
    • Cell > Cell Details
    • Cell > Cell Grouping
    • Cell > Cell Grouping (Proportion)
    • Correlation
    • Dot Plot
    • Feature
    • Markers
    • Violin Plot
  • Analytics
    • Affymetrix
    • DESeq2
    • FGSEA
    • gscreend
    • Seurat
    • STACAS
  • Projects
  • Commands
    • g3tools
    • ConvertMetaData
    • ConvertData
    • LoadData
    • LoadSingleCell
    • RunAnalysis
  • Installation
    • Server Installation (AMI-Based)
    • Server Installation (Docker-Based)
G3Bio Logo
 

Copyright © G3Bio 2023

  • About
  • Gallery
  • Docs
  • Contact
  • Getting Started
  • DataHub
  • Views - Bulk Collection
  • Views - Single Cell Collection
  • Analytics
  • Projects
  • Commands
  • Installation