Single Cell - Violin Plot
Violin plot view
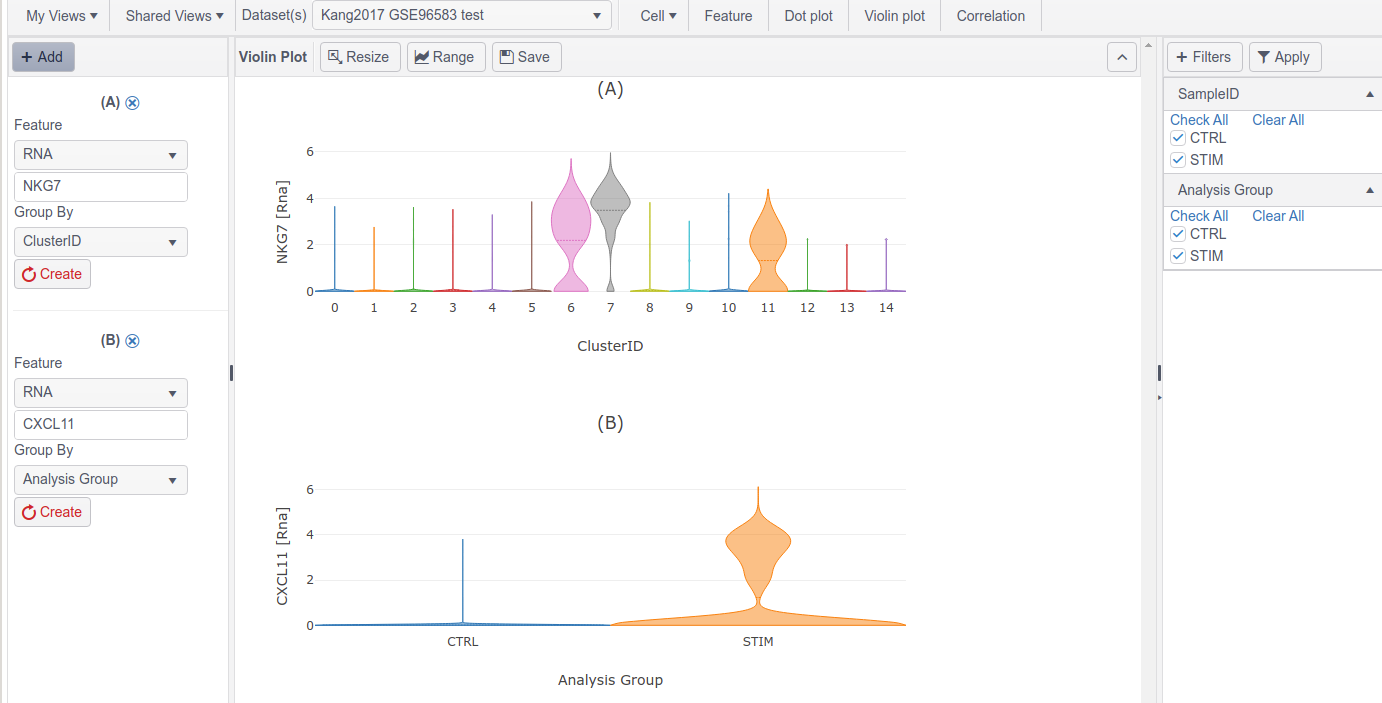
Usage
This chart allows to compare distribution of feature measurements across groups, e.g. gene expression levels across cell clusters. It is similar to Box Plot
Input
- Feature: select a feature type and name.
- Group By: the column shown on X-axis
Options
- Click Add to create additional charts and show side-by-side.