The DataHub module of G3Edge is designed for managing and visually exploring multiomics data. It allows users to build a custom data repository by integrating both public and internal datasets.
With a user-friendly interface and powerful visualization tools, G3Edge facilitates data interrogation and visual exploration of hidden relationships between clinical or molecular features.
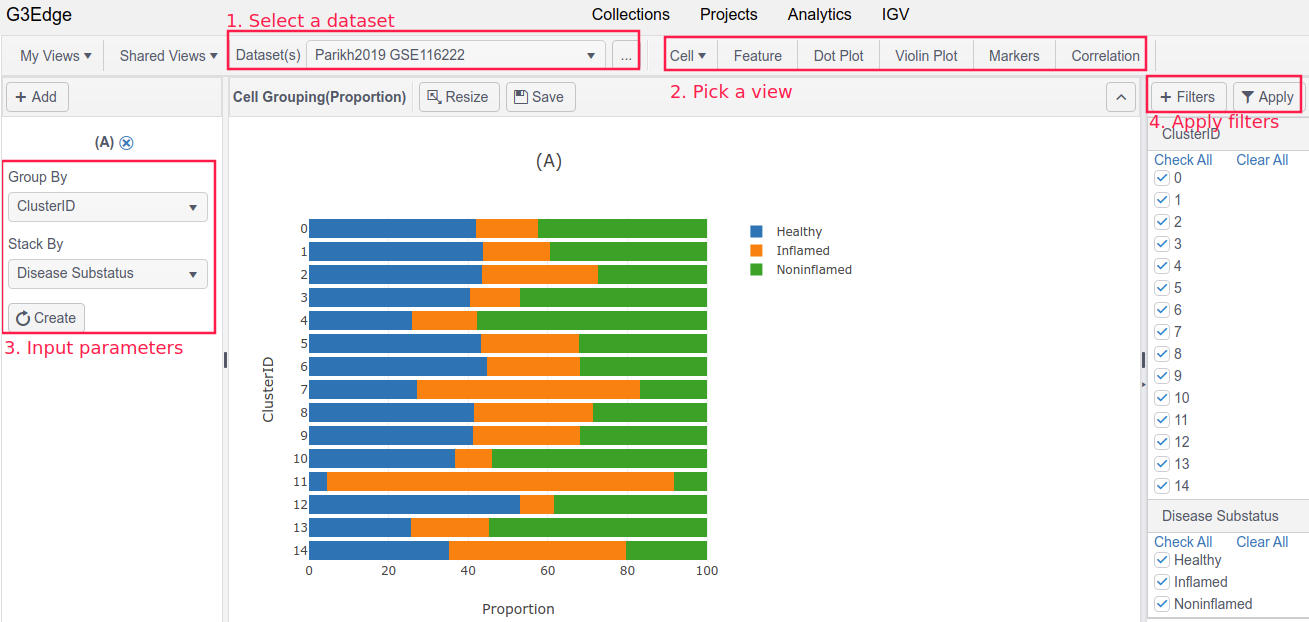
Under DataHub, it simply takes four steps to create a view.
- Step 1: Select a dataset
- Step 2: Pick a view
- Step 3: Input chart parameters, such as a gene name, or a feature on X-axis
- Step 4: Apply a sample filter to perform sub-cohort analysis
G3Edge provides multiple functionalities to help users explore data, including
- Interactive charting
- Sub-cohort analysis
- Saving a chart/view for quick access later
- Sharing views with other users
- Multi-tab browsing
Load data
We have developed G3Tools to facilitate data loading. Currently the following data formats are supported.
- Sample metadata/clinical data, in a table format
- DNA somatic mutation: gene mutation, in MAF or VCF format
- Copy number variation: CNV, in a table format; we support continuous (e.g. log2ratios), and discrete (e.g. from Gistic2 calls).
- DNA Methylation: methylation beta values, in a table format
- RNA expression - Bulk tissue : gene expression, in a table format of genes and samples
- miRNA expression: microRNA gene expression, in a table format of genes and samples
- Protein expression - RPPA : protein expression, in a table format of assay-id and samples
- Metabolomic data : metabolite profiling, in a table format of metabolites and samples
- Gene dependency data: gene dependency scores from CRISPR/RNAi screening, in a table format
- Comparison data: a table of genes with associated p-values, fold-changes, and other statistics
- Single cell data: scRNA, scATAC, ADT, in a tsv, mtx, hd5a, loom or related formats
We keep working on extending our framework to support new data types as they arise.
Public data sets
G3Bio also created and maintains G3Portal - a collection of ready-to-explore public data sets, including projects like TCGA, GTEx, CCLE/DepMap, and immuno-oncology single cell studies. To search data sets currently available, please check Datasets.