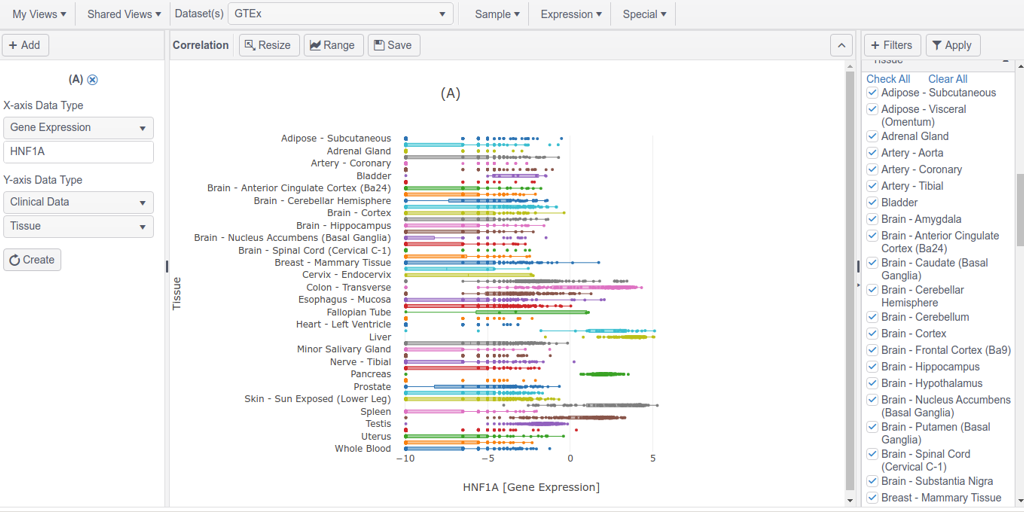
G3Bio

  • About
  • Gallery
  • Docs
  • Contact

Box Plot

Box plot shows the sample distribution across groups of a categorical variable.

Previous/Next
Waterfall Plot Clinical Data Table View
featured.png
  • More Charts
  • Celltype Markers
  • Dataset Explorer
  • Heatmap View
  • Tissue-specific Expression
  • Volcano Plot
  • Waterfall Plot
  • Box Plot
  • Clinical Data Table View
  • Correlation Plot
  • Dot Plot
  • Gene-set Enrichment Plot
  • Grid Chart
  • Job Submission View
  • Lollipop Plot
  • Stackbar Plot
  • Survival Plot
  • tSNE Plot
  • Violin Plot
G3Bio Logo
 

Copyright © G3Bio 2025

  • About
  • Gallery
  • Docs
  • Contact
  • Getting Started
  • DataHub
  • Views - Bulk Collection
  • Views - Single Cell Collection
  • Analytics
  • Projects
  • Commands
  • Installation