Survival Plot
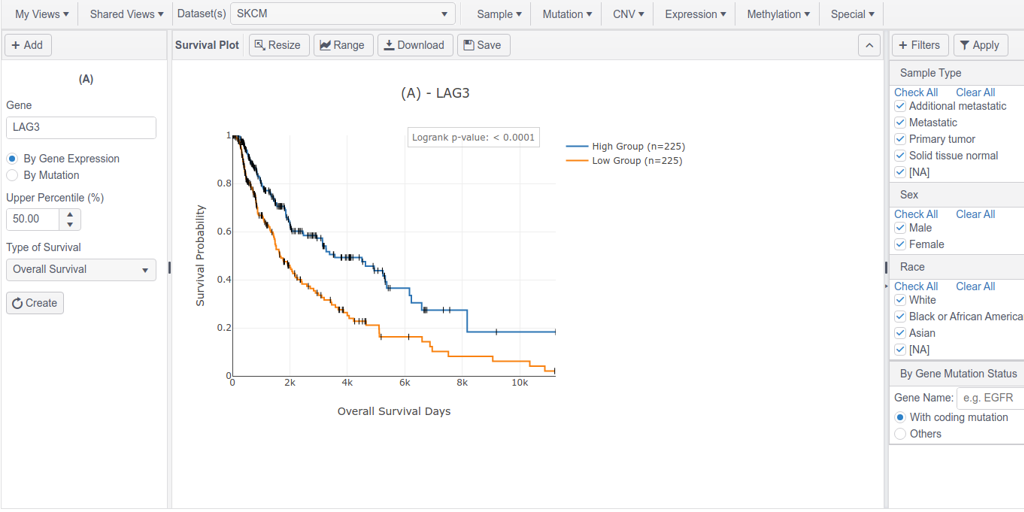
Survival plot shows the curves constructed on time-to-event data, where subjects are often stratified by a grouping variable.
The survival plot measures the fraction of patients living for a certain amount of time after event occurs.
Previous/Next