G3Bio

    PROJECTS

    Projects

    The Projects module of G3Edge is tightly linked to the Analytics module. It allows users to view final results (e. g. tables or charts) generated from an analysis run. One projct can contain analysis results from one or multiple analysis runs. Users can also create new projects, add additional data and views to an exsiting project, and share a project with other users.

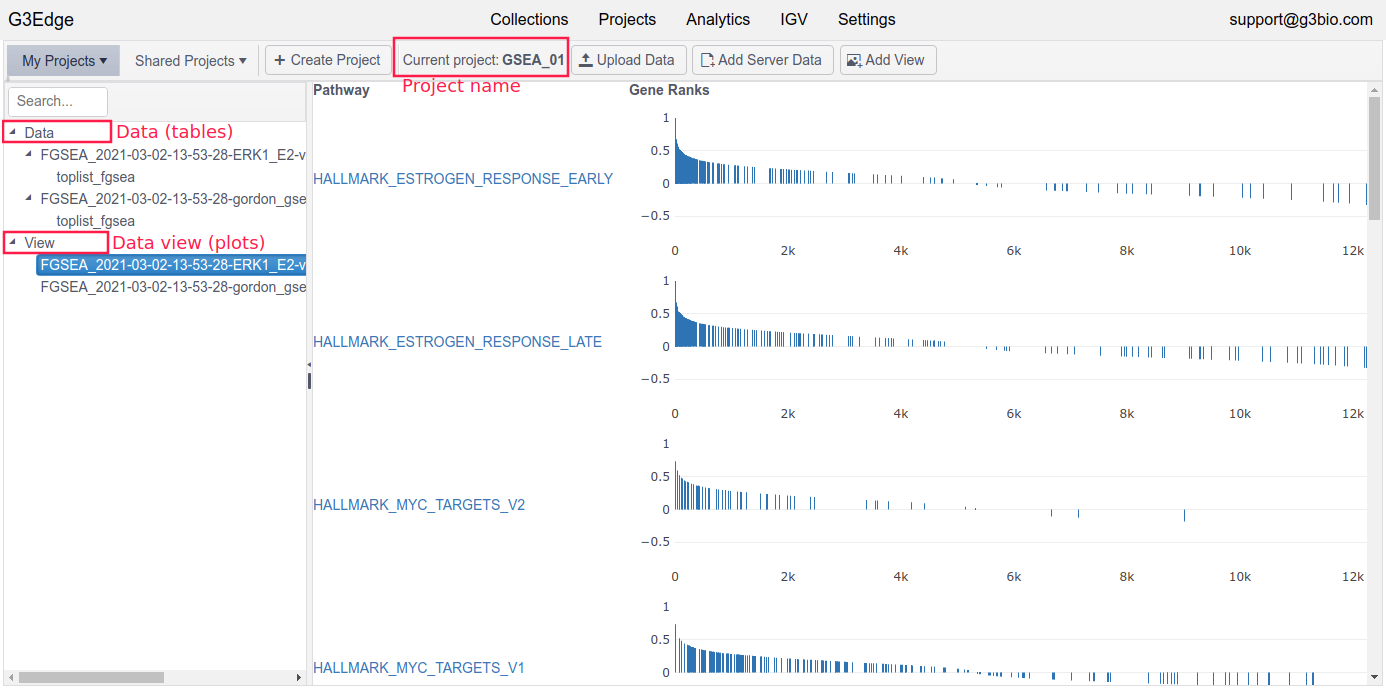
    Here is a project example showing results from a gene set enrichment FGSEA run, where the (current) project name and two sections of a project (Data and View) are highlighted.

    projects

    My Projects

    Clcking this button lists all the saved projects from a user, and he/she can pick a project to view. It also allows a user to find, delete and share a project by clicking “Find/Manage”.

    Shared Projects

    All the shared projects (from another user) are listed here. It also allows a user to find, delete a shared project by clicking “Find/Manage”.

    Create Project

    Users can create a new project (by adding a name and a short description) here.

    Upload Data

    Click this button to upload (local) data into the current project.

    Add Server Data

    This button allows users to transfer data directly to a folder on a G3Edge server.

    Add View

    Users can add additional View of data (into current project) by clicking this button.

    • DataHub
    • Projects
    • analytics
      • Affymetrix
      • DESeq2
      • FGSEA
      • gscreend
      • Seurat
      • STACAS
    • collections-view-bulk-sample
      • CNV > CNV Distribution
      • CNV > Gene List
      • Expression > Expression Grouping
      • Expression > Expression Heatmap
      • Expression > Expression Volcano
      • Expression > Expression Waterfall
      • Methylation > Methylation Beta Values
      • Mutation > Alteration Distribution
      • Mutation > Mutated Genes
      • Mutation > Mutation Landscape
      • Sample > Data Availability
      • Sample > Sample Details
      • Sample > Sample Grouping
      • Special > Waterfall
      • Special > Correlation
      • Special > Grid Pattern
      • Special > Survival
    • collections-view-single-cell
      • Cell > Cell Details
      • Cell > Cell Grouping
      • Cell > Cell Grouping (Proportion)
      • Correlation
      • Dot Plot
      • Feature
      • Markers
      • Violin Plot
    • commands
      • g3tools
      • ConvertMetaData
      • ConvertData
      • LoadData
      • LoadSingleCell
      • RunAnalysis
    • getting-started
      • Quick Tour
    • installation
      • Server Installation (AMI-Based)
      • Server Installation (Docker-Based)
    G3Bio Logo
     

    Copyright © G3Bio 2025

      • DataHub
      • Projects
      • analytics
      • collections-view-bulk-sample
      • collections-view-single-cell
      • commands
      • getting-started
      • installation