Correlation
Correlation view
Usage
Input: select features for X- and Y- axis
Options
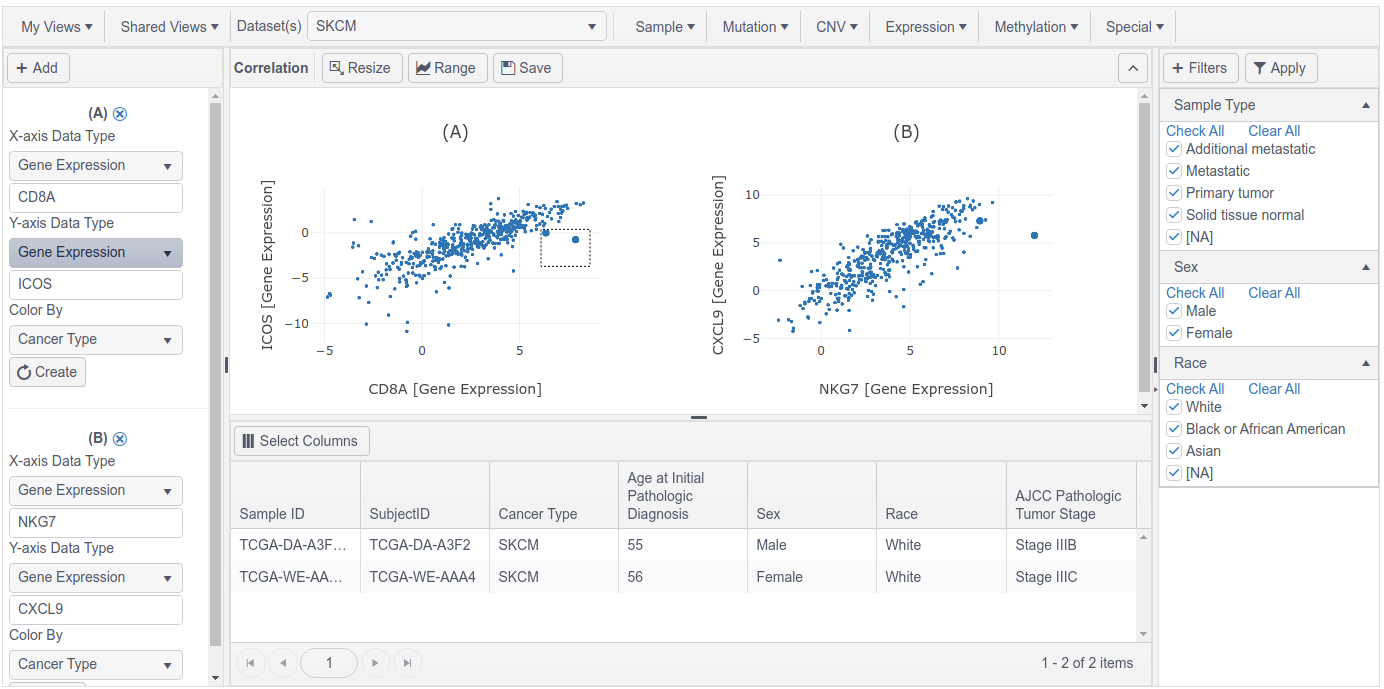
- Add multiple charts by clicking Add on the top-left corner.
- Selecting points in one chart also (1) highlights the same samples in the remaining charts, and (2) shows the sample table below the charts.
- To unselect points, select an empty region in a chart.