Survival
Survival view
Usage
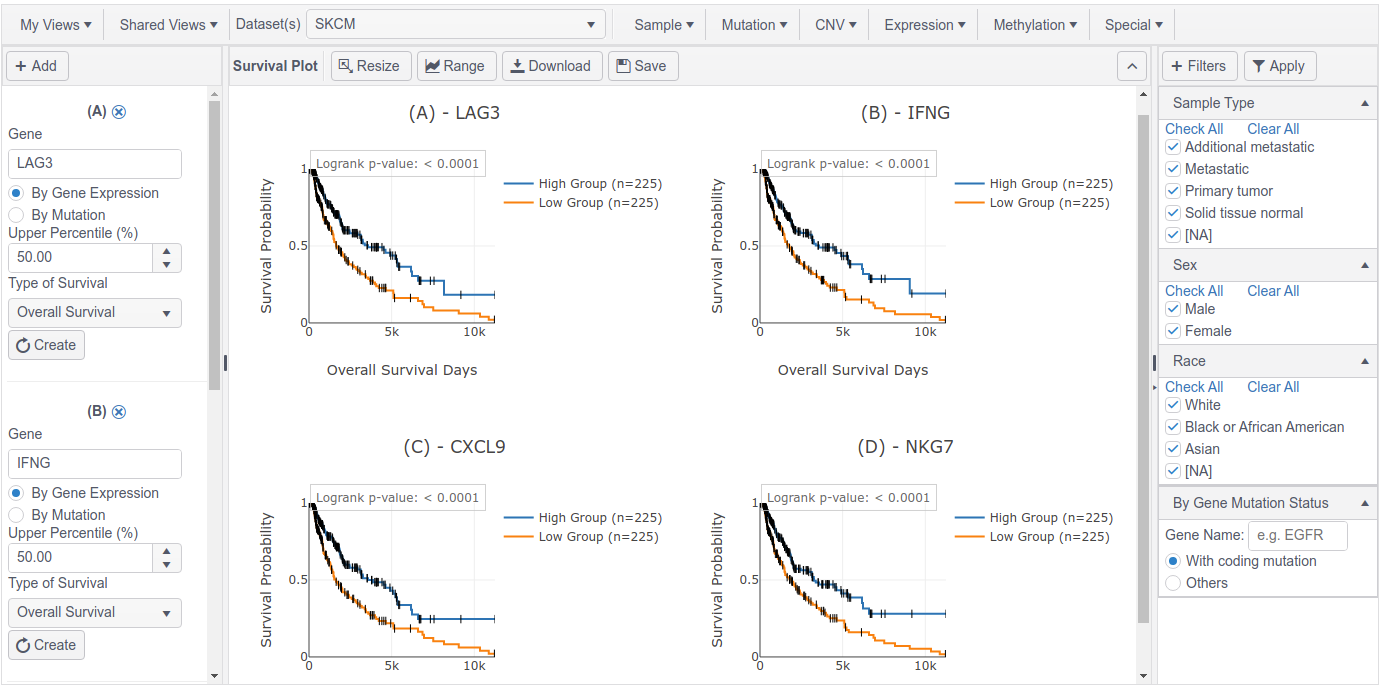
Survival view shows the curves constructed on time-to-event data, where subjects are often stratified by a grouping variable.
The survival plot measures the fraction of patients living for a certain amount of time after event occurs.
Input
Patients can be stratified by gene expression levels or mutation status.
- A gene name
- Select “By Gene Expression” or “By Mutation”.
- Select a percentile threshold if “By Gene Expression” was selected.
Options
- Depending on the dataset, multiple survival types might be available to choose.
- Click Range (on the top panel) to set the ranges of the X-axis.