Quick Tour
G3Edge is an integreted solution for managing large-scale multiomics data. Currently it contains three modules: DataHub, Analytics and Projects.
DataHub
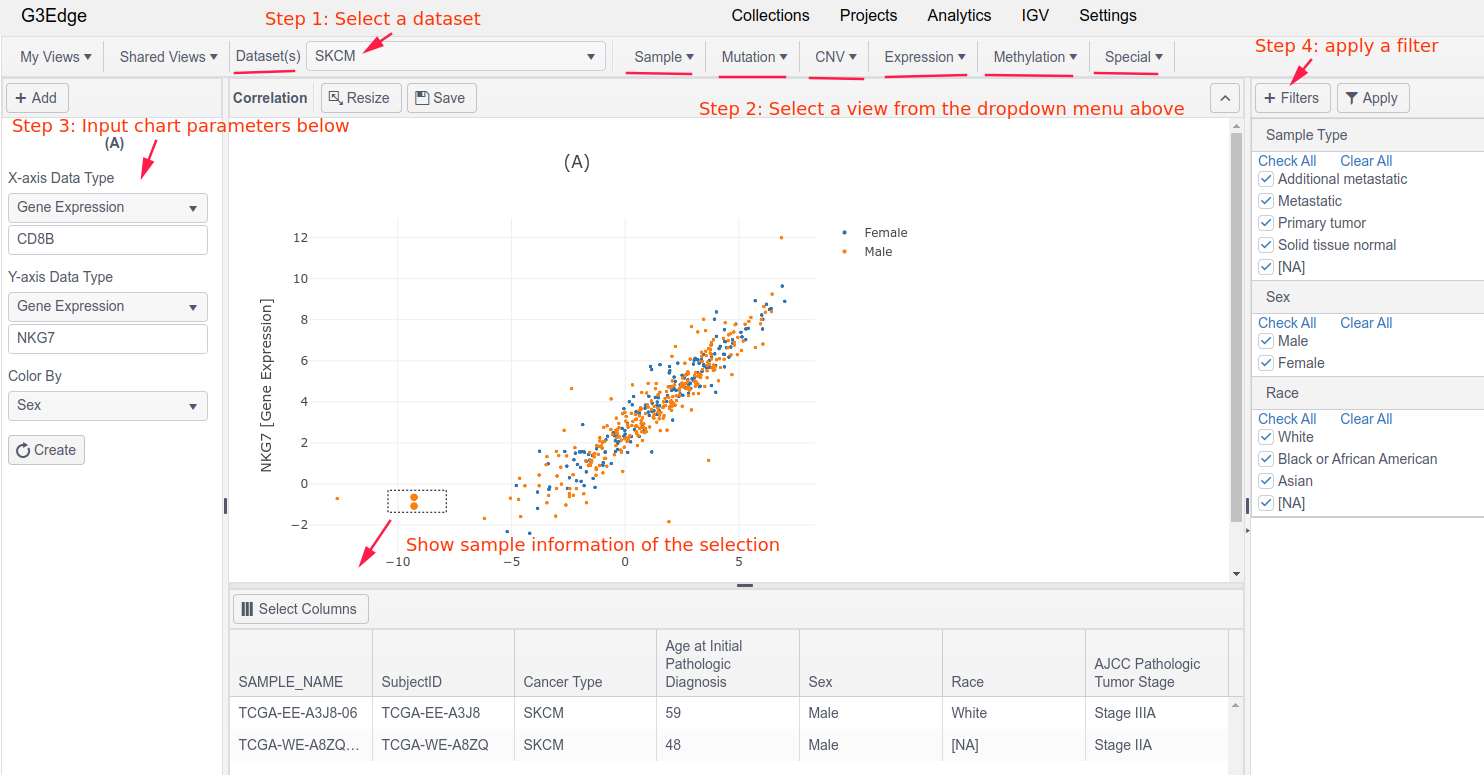
The DataHub module of G3Edge is a web platform for managing and visually exploring multiomics data, such as finding correlations between disease status and changes in molecular or biological measurements.
With a user-friendly interface, G3Edge can turn data to visualization in just a few clicks.
- Step 1: Select a dataset
- Step 2: Select a view (where most views are grouped by available data types)
- Step 3: Input chart parameters, such as a gene name, or a feature on X-axis
- Step 4: Optionally, apply a sample filter to perform cohort analysis
Analytics
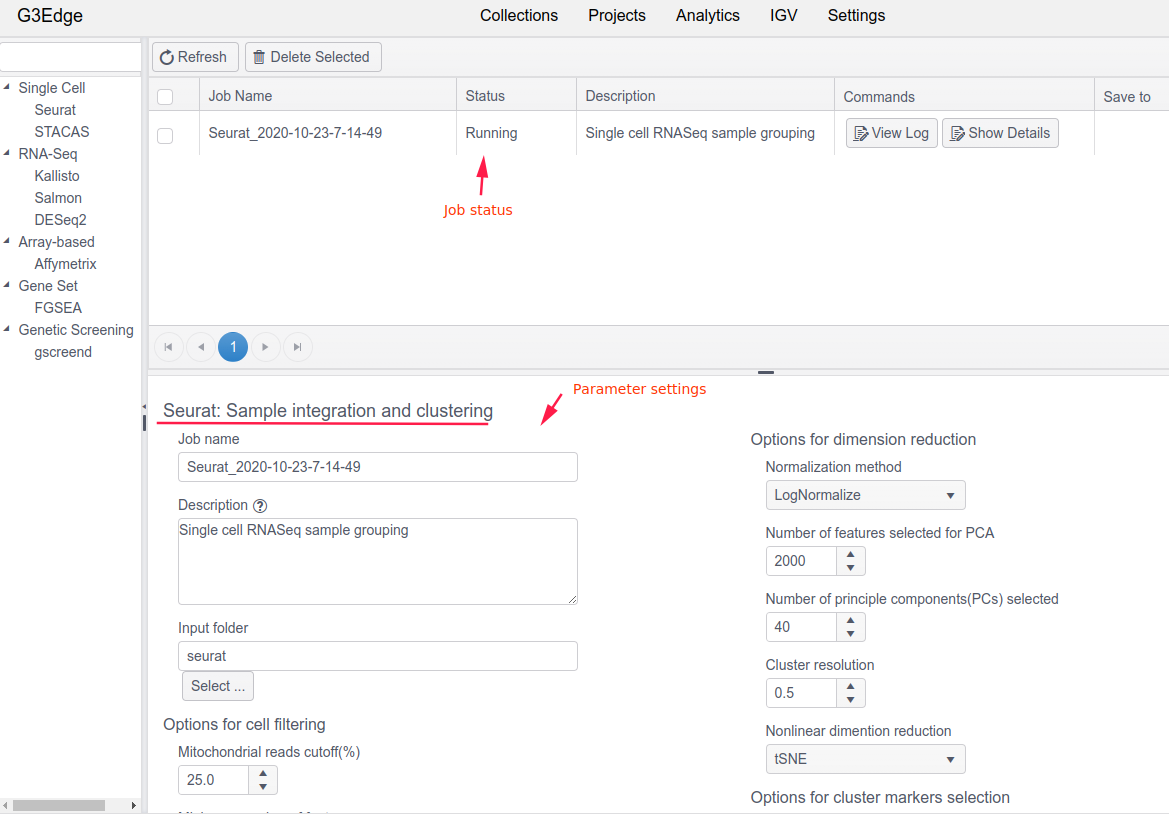
The Analytics module of G3Edge contains a set of prebuilt common analysis pipelines. It provides an intuitive user interface for users to run Docker (or Singularity) - based analysis tasks or workflows. Users can specify parameters, monitor job status, and save final output to a project or download result files to local drives for further analysis. For example, users can use Seurat to run single-cell RNA-Seq analysis. The implementation of Analytics module allows for running jobs on local servers or on cloud (e.g. AWS), automatically handling job parallelization and re-execution on failed jobs. Incorporating custom pipelines/workflows into Analytics module is also feasible.
Projects
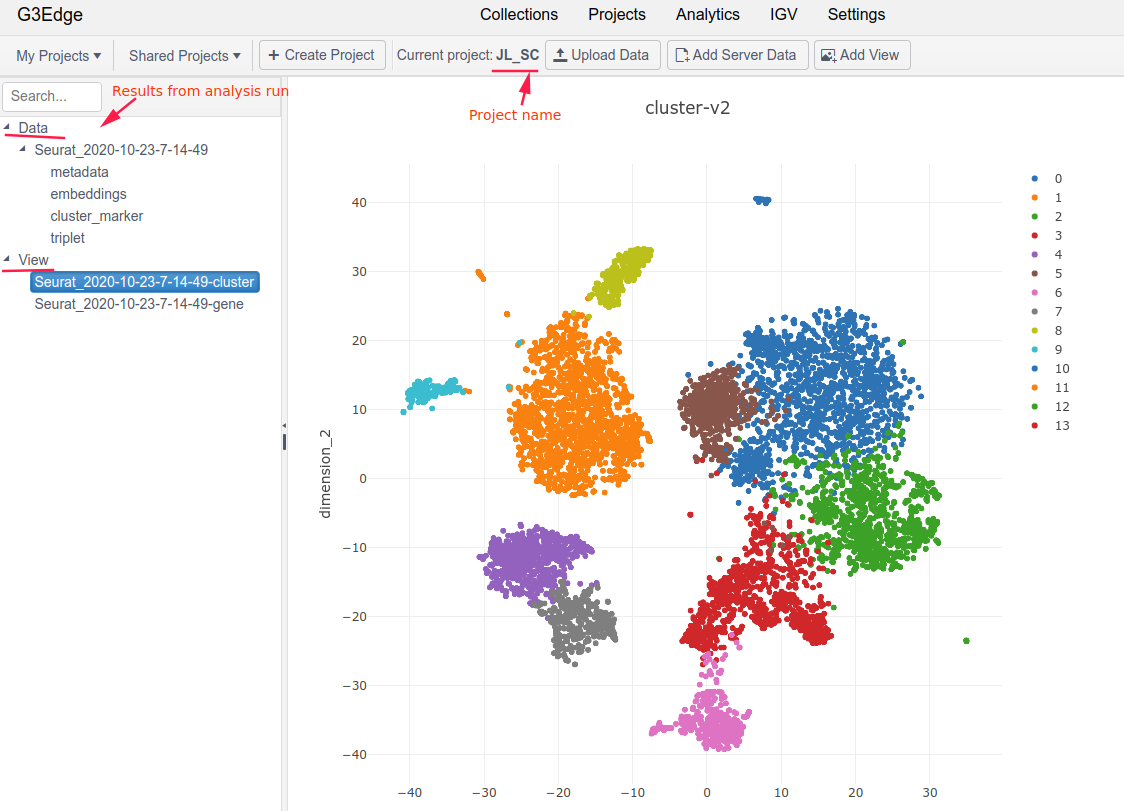
The Projects module of G3Edge is tightly coupled with the Analytics module, so that users can view results (e. g. tables or charts) generated from an analysis run. Each projct may contain analysis results from one or multiple analysis runs.
Here is an example of a project showing results from a Seurat run.
Tips
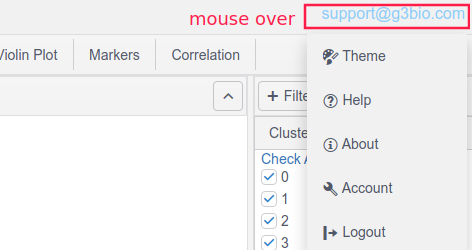
Moving the mouse over the username or email (on the top-right corner) will display a drop-down menu, where users can choose a different theme, get help (a link to this page), and set account information.
Also, G3Edge supports multiple-tab browsing: Right-Click G3Edge (on the top-left corner), and select “open link in a new tab”.